
Figure 2. Mast cells degranulate upon contact with VV.
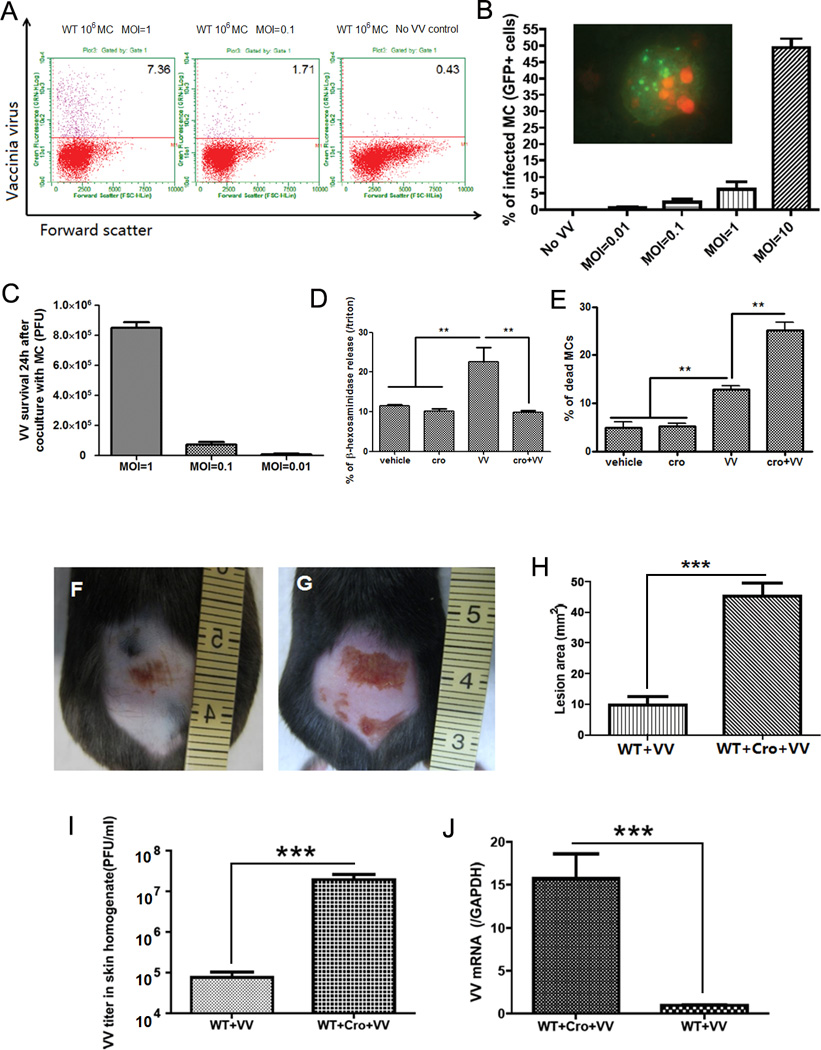
(A) Mast cells were infected with VV at different MOI for 24 h and analyzed by FACS. The right plot shows resting mast cells before virus interaction; the two other plots show cells after contact with VV. The upper quadrant number is the percentage of infected mast cells. (B) FACS analysis of VV expression in mast cells infected with VV (GFP+ cells) at different MOI. The insert shows green fluorescence in mast cells infected with VV. The nucleus was stained in red with propidium iodide (PI). (C) VV titer 24 h after co-culture VV with mast cells at different MOI. VV titer in the supernatant was expressed as PFU by plaque assay in BS-C-1 cells. (D) Mast cell β-hexosaminidase release (as index of granule content release) 1 h after contact with VV. The granule release was blocked by adding cromolyn (cro) to the medium. **P<0.01 compared to other groups. (E) Mast cell death was measured with trypan blue 1 h after contact with VV. The number of dead cells was increased by cromolyn in the medium. *P<0.05. All the in vitro experiments have been performed in triplicate (F) Wild-type C57BL/6 mice at 72 h following VV inoculation. (G) Cromolyn pretreated wild-type C57BL/6 mice at 72 h following VV inoculation. (H) Quantification of skin lesion size (mm2) in non-pretreated and cromolyn-pretreated mice at 72 h post infection. (I) Quantification of viral load in skin lesions expressed as PFU/ml. (J) Quantification of VV early gene expression in skin lesions by real-time quantitative RT-PCR. ***P<0.001. Three independent experiments with 4 mice per group were performed for each experiment