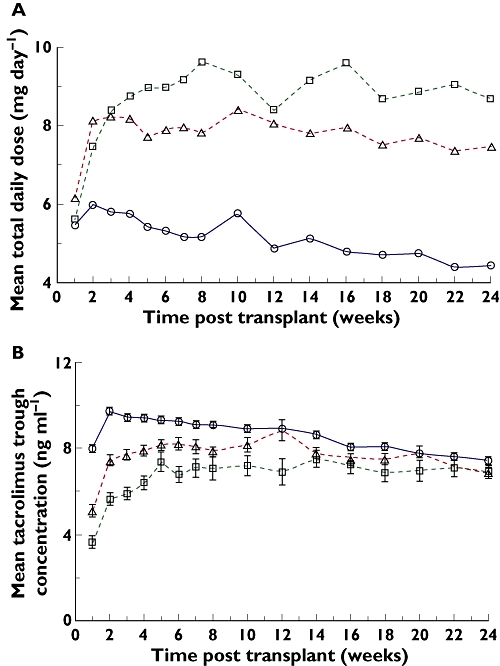
Figure 1.

Tacrolimus doses and troughs by CYP3A5 genotype (○ CYP3A5*3/*3, ▵ CYP3A5*1/*3, □ CYP3A5*1/*1) over the first 6 months post transplant. (A) Total daily doses by CYP3A5 genotype. (B) Trough concentrations by CYP3A5 genotype (mean ± SE)

Tacrolimus doses and troughs by CYP3A5 genotype (○ CYP3A5*3/*3, ▵ CYP3A5*1/*3, □ CYP3A5*1/*1) over the first 6 months post transplant. (A) Total daily doses by CYP3A5 genotype. (B) Trough concentrations by CYP3A5 genotype (mean ± SE)