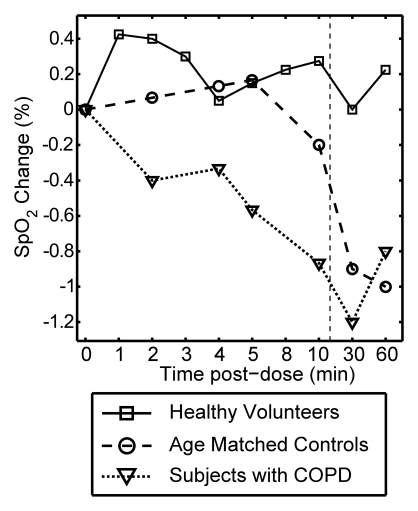
Figure 3c:
Graphs show mean change in vital signs after xenon dose administration relative to baseline as a function of time. Data were acquired after inhaling the xenon dose and were averaged over all doses for a given time point (four doses for healthy volunteers, three doses for age-matched control subjects and subjects with COPD) but are separated by subject group. Dashed vertical lines = time after which subjects were permitted to move about freely. Graphs show (a) systolic blood pressure (BP), (b) diastolic blood pressure, (c) blood oxygen saturation (Spo2), (d) heart rate, and (e) respiratory rate. No clinically important changes in any of these vital signs were noted for any of the groups.

