
Figure 2b:
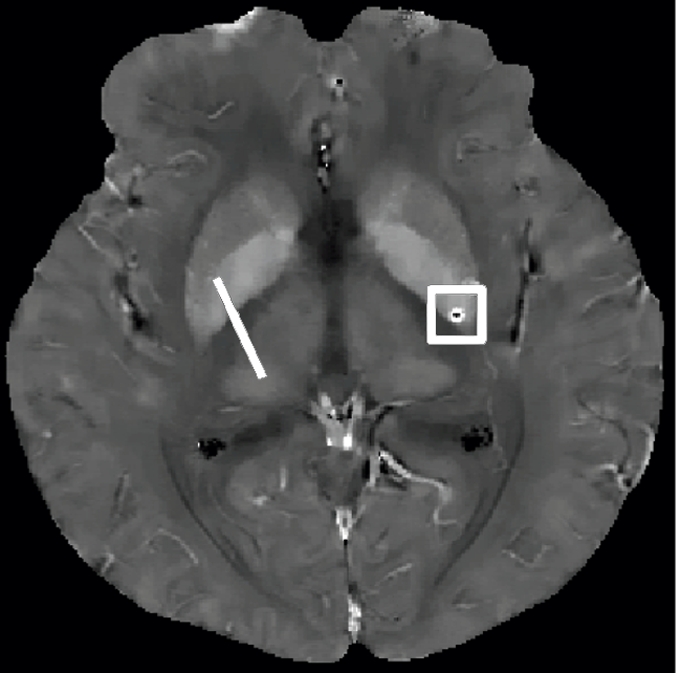
Qualitative and quantitative analysis of the QSM profile in a 40-year-old woman at different echo times. (a–c) Axial QSM profiles reconstructed at the various echo times (a) 20.5 msec, (b) 41.3 msec, and (c) and 51.7 msec do not show echo time dependence at visual inspection. The window/level of the QSM is adjusted from −0.2 to 0.4 ppm. White line in b = mark of line segment, white square in b = area of total susceptibility measurement. (d, e) Graphs show echo time (TE) independency of the QSM profile, which is quantitatively confirmed by the susceptibility measured along (d) a line segment and by (e) the total susceptibility of the microbleed at various echo times. (f) Graph shows that the noise of the QSM decays monotonically with increasing echo time (TE).