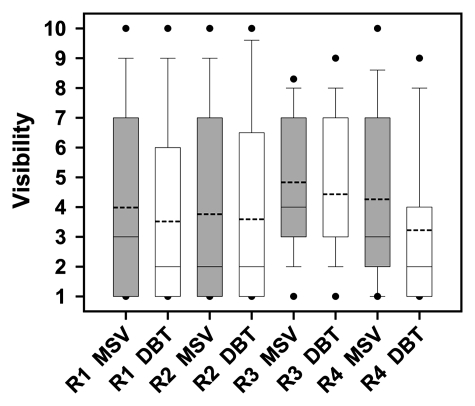
Figure 2:
Box plot of each reader’s visibility ratings (1 = obvious; 10 = subtle) for masses on MSVs and DBT images. The boundary of the box closest to zero indicates 25th percentile and the boundary of the box farthest from zero indicates 75th percentile. Dashed and solid lines within each box indicate mean and median ratings, respectively. For reader 3 (R3) DBT, the median line coincides with 25th percentile. Whiskers above and below each box indicate 95th and 5th percentiles, respectively. The dots represent outliers. The P values for readers 1 (R1), 2 (R2), 3, and 4 (R4) were .19, .53, .13, and .001, respectively.

