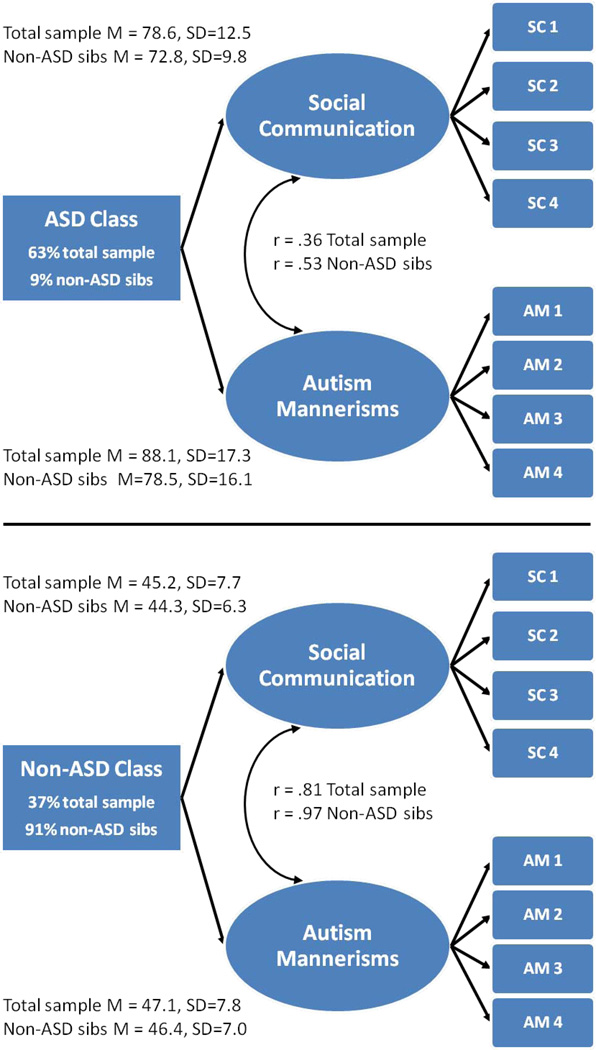
Figure 1.
Two-factor/two-class model using the Social Responsiveness Scale in the total available sample (N=6,949) and non-autism spectrum disorder (ASD) sibling sub-sample (N=2,701). Note: The ASD class had substantially higher symptom levels (t-scores) than the non-ASD class in both the total sample and non-ASD sibling sub-sample (p<.001). Non-ASD sibs designate model results for the non-ASD sibling sub-sample. SC 1–4=social communication/interaction scales from the Social Responsiveness Scale. AM 1–4=autism mannerisms item packets from the Social Responsiveness Scale. Horizontal black line separates results for the empirically-derived ASD and non-ASD classes. Curved double-headed arrows represent factor correlations in the ASD and non-ASD classes.

