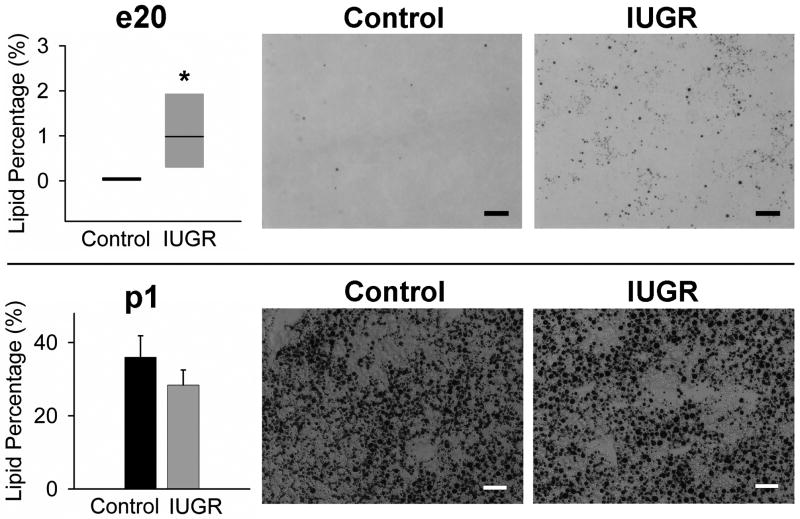
Figure 1. Lipid quantification by osmium staining at e20 and p1.
Osmium stained sections were used to quantify lipid deposition by image analysis. Black dots in the images indicate lipid (triglyceride) droplets stained with osmium. For e20 (upper), n=6 (3 males and 3 females from 3 litters) were studied per group. For p1 (lower), 6 Control and 7 IUGR males from 6/7 litters were studied. *p<.05 vs. Control. Scale bars; 40 μm.

