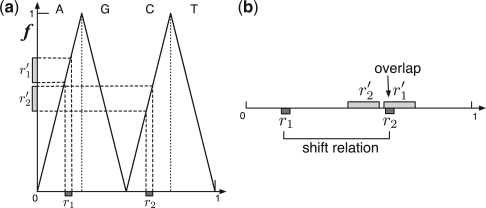
Fig. 3.
Mappings from two contiguous regions (r1 and r2) to their images (r′1 and r′2). (a) The relations between the contiguous regions and their images are indicated on the left shift function f. (b) All contiguous regions are illustrated on the same unit line. Since the region r2 overlaps with the image r′1, there is a shift relation between r1 and r2.

