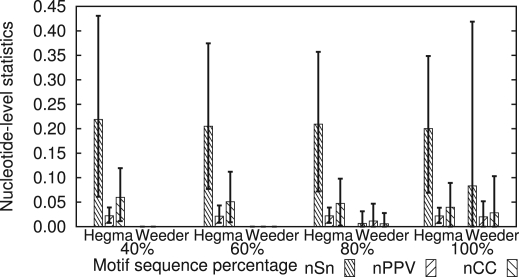
Fig. 9.
Average statistics for the 10 most frequent motifs at the nucleotide level. Boxes show the average values for the statistics of motifs. Error bars show the maximum and minimum values of the statistics. The setting is the same as that in Figure 8.

