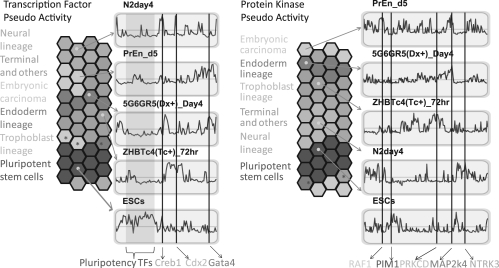
Fig. 3.
GATE visualization of transcription factor and protein kinase pseudo-activity scores applied to 44 cell types. Each hexagon represents a different cell type, color-coded based on the different lineage groups, but ordered based on pseudo-activity scores correlation with other cell types. Next to each hexagonal heatmap there are representative (left) transcription factors and (right) protein kinases, pseudo-activity score profiles for all transcription factors and kinases for selected samples. Red represents up-regulation and green represents down-regulation of the transcription factors or kinases regulating co-expressed modules across the 44 samples for a specific sample. Specific transcription factors and protein kinases are highlighted with straight vertical lines and are annotated at the bottom. Transcription factors and kinases are ordered along the line corresponding to the order determined by hierarchical clustering. The hexagonal grid folds on itself to form a torus such that hexagons at the edges are close to hexagons from the opposite side.

