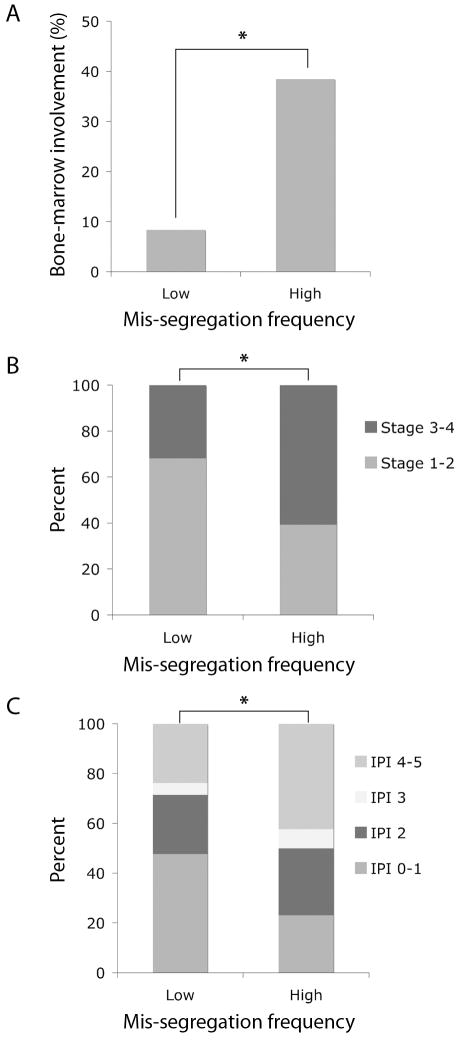
Figure 3.
A, the percentage of patients with tumor bone marrow involvement in groups with low and high frequencies of chromosome mis-segregation. *, p < 0.05, Pearson's χ2-test, n = 24 and 26 for low and high mis-segregation groups, respectively. B, the percentage of patients stratified based on their tumor stage upon diagnosis and with respect to frequencies of chromosome mis-segregation. *, p < 0.05, Pearson's χ2-test, n = 22 and 28 for low and high mis-segregation groups, respectively. C, the percentage of patients stratified based on their IPI score upon diagnosis and with respect to frequencies of chromosome mis-segregation. *, p < 0.001, Pearson's χ2-test, n = 21 and 26 for low and high mis-segregation groups, respectively.

