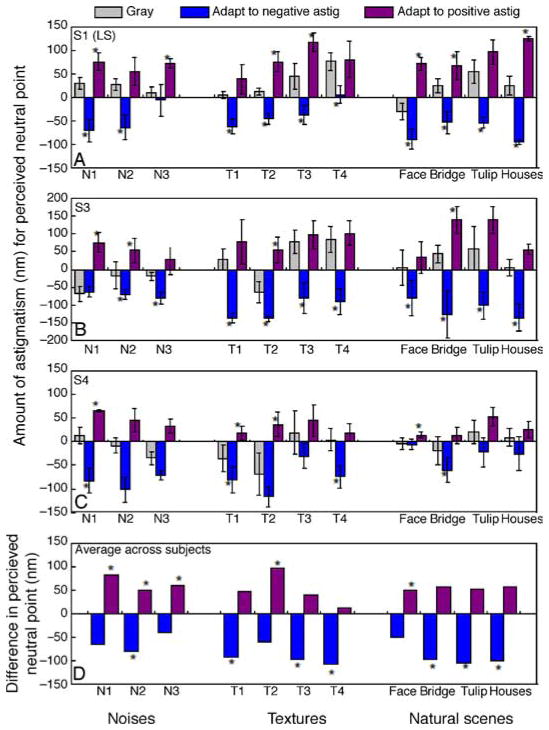
Figure 9.
(A–C) Stimulus levels that appeared isotropic before or after adapting to the same image with negative (blue) or positive (purple) astigmatism tested on three subjects for individual images of noise, close-up textures, or natural scenes. The vertical axis represents the amount of astigmatism (in nm; negative for vertical and positive for horizontal) that makes the image appear isotropically blurred for the observer. (D) Difference in the perceived neutral point before and after adaptation to negative astigmatism (blue) or positive astigmatism (purple) shown on average across the three subjects and for each of the 11 tested images. The vertical axis represents the difference in perceived neutral point in terms of the amount of astigmatism (in nm) necessary for the observers to perceive the test images as isotropically blurred. Negative values mean that the observer shifted their neutral point to images more vertically oriented, and vice versa for positive values. Error bars represent standard deviation across measurements; * indicates significant differences (p < 0.05) before vs. after adaptation.

