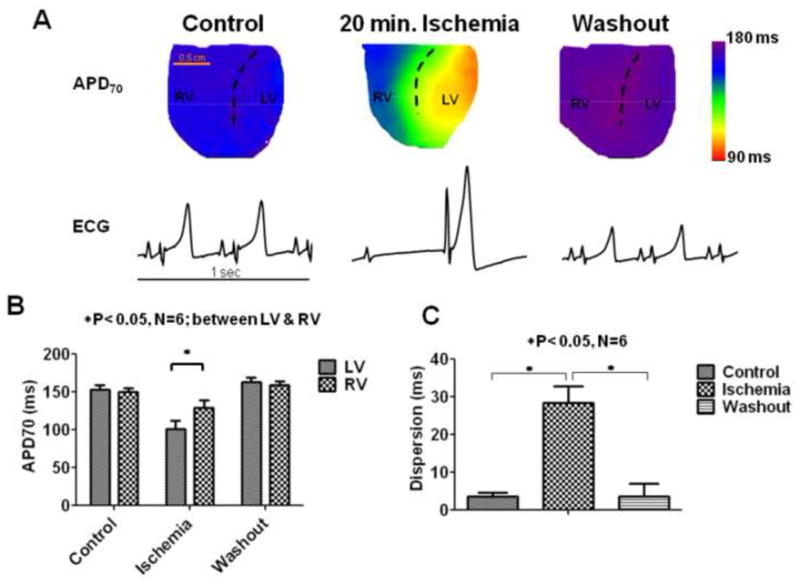
Figure 1.

APD distribution during ischemia. (A). APD70 maps on the anterior surface of the guinea pig ventricle and the underlying pseudo-ECGS tracings (each of 1 second duration) during control, after 20 minutes of ischemia, and after washout are shown. The dashed lines are approximately along the left anterior descending (LAD) coronary, which separates the right and left ventricles respectively (RV and LV). The heart can be seen to shrink in size during ischemia. (B) Quantification of the APD70 in LV and RV, and (C) the dispersion of APD70 defined as the absolute difference of the mean values between LV and RV are shown for control (C), 20 minutes of ischemia (I), and washout conditions (W).
