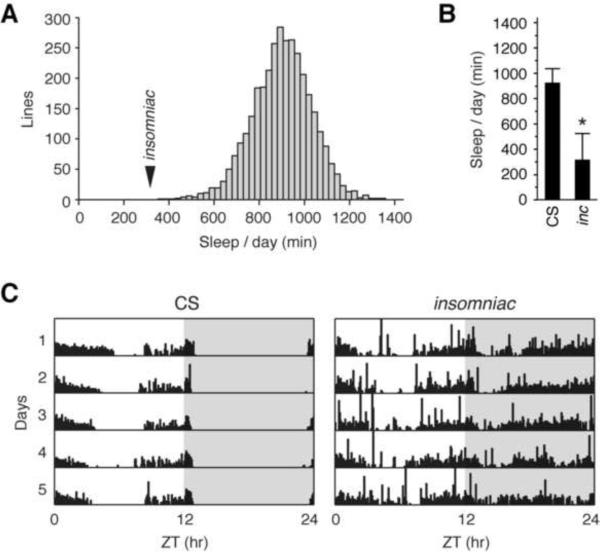
Figure 1.
Isolation of insomniac
(A) Histogram of average daily sleep for screened lines. Mean ± SD across all lines is 901 ± 131 min. Arrowhead indicates mean sleep for insomniac. (B) Average daily sleep for wild-type CS (n=95) and insomniac (n=90) males. Mean ± SD is shown. * p < .0001. (C) Five day locomotor traces of the median individual CS and insomniac animals analyzed in (B) are shown. Shading within plots indicates night.

