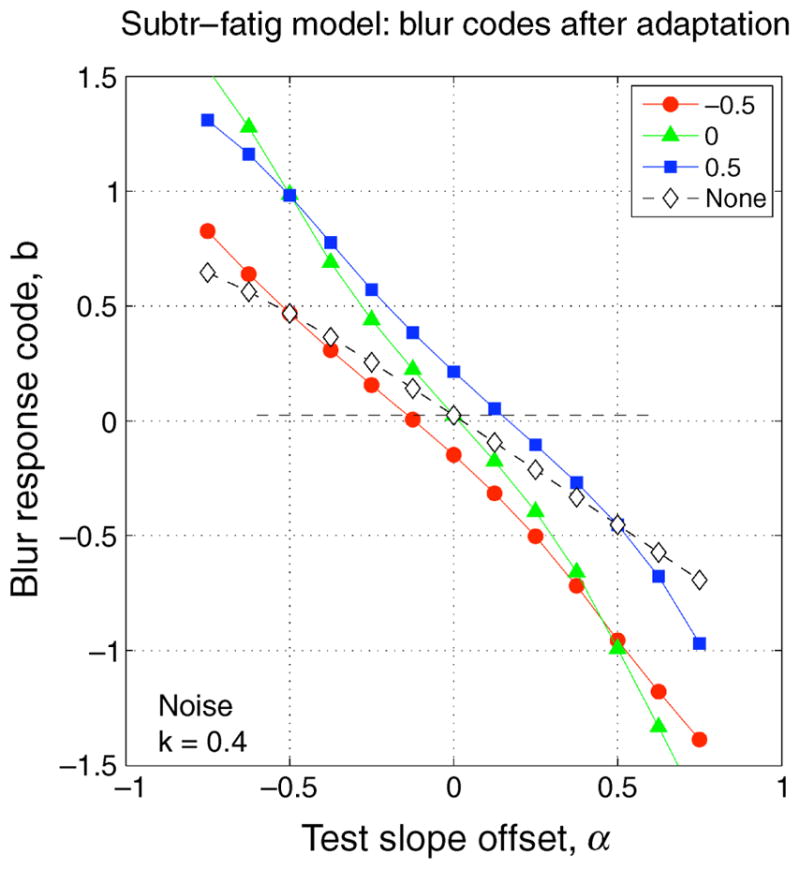
Figure 8.

Blur codes b as a function of test slope offset α, for noise images, after subtractive adaptation (k = 0.4) to blurred (α = −0.5, red circles), 1/f (α = 0, green triangles), or sharpened (α = +0.5, blue squares) noise images, or no subtraction (open diamonds).
