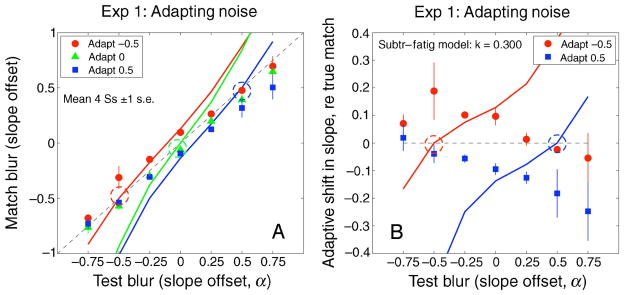
Figure 9.
(A) Observed and predicted blur matches for the noise images in Experiment 1. Predictions are from the simple fatigue model (Equation 2), with adaptation strength k = 0.3. (B) Blur aftereffects across the range of test blurs, expressed as the difference between observed and veridical matches, for sharpened (blue squares, α = 0.5) and blurred (red circles, α = −0.5) adapters. The model exhibits “repulsion” of test blur matches away from the adapting blur (dashed circles) for all 3 adapters. This was a very poor prediction for Experiment 1.

