Figure 3.
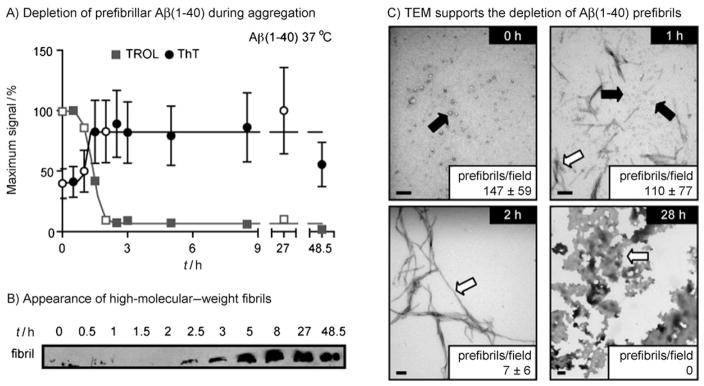
Monitoring the decrease of prefibrillar Aβ over time by using TROL. A) 25 μM Aβ(1–40) was suspended in PBS and incubated at 37 °C with shaking. At the indicated time points, 10 μL was removed and tested for either TROL or ThT reactivity in triplicate. Open symbols correspond to the samples used in the TEM experiments. Error bars represent standard deviation. In some cases the error is smaller than the data symbol. B) A general anti-Aβ antibody (6E10) was used to monitor high-molecular-weight fibrils. At the indicated time points, samples were separated by electrophoresis, and the interface between the stacking and resolving gels was blotted. C) TEM was used to evaluate the content of Aβ mixtures. The levels of prefibrils were roughly quantified at each time point (average prefibrils per 13.2 μm2 field). Prefibrils were defined as globular oligomers and short protofibrils. Scale bar = 100 nm. Arrows indicate prefibrils (black arrow) and fibrils (open arrow).

