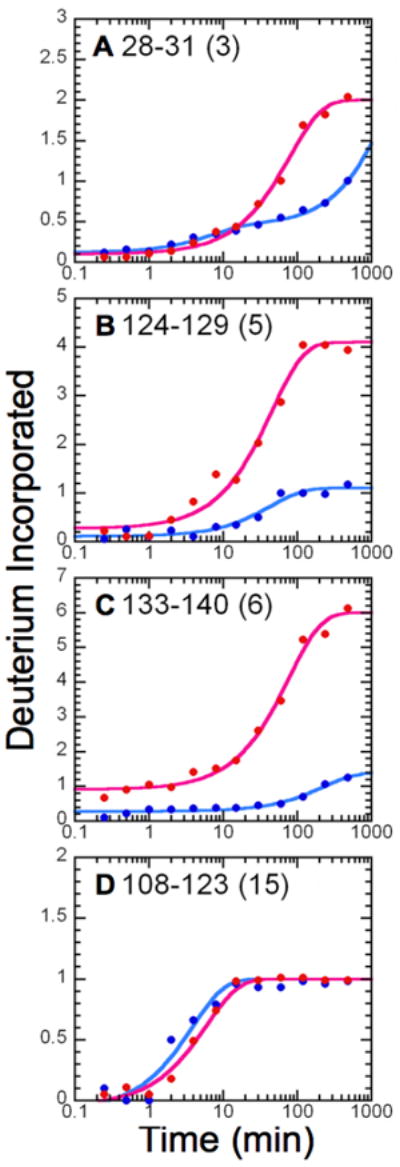
FIGURE 2.

Amide H/D exchange kinetic profiles for MPGES1. Shown are the average kinetic profiles for deuterium incorporation as a function of time for MPGES1 complexed with either GSH (blue) or 1 (red), with the number of exchangeable amide protons for each peptide in parentheses. The amplitudes and rate constants for each peptide are as follows: (A) peptide 28-31 (GSH), A1 = 0.33 ± 0.03, k1 = 0.14 ± 0.02 min-1, A2 = 2.55 ± 0.02, k2 ≤ 5.12 × 10⁻⁴; peptide 28-31 (GSO3−), A1 = 1.90 ± 0.03, k1 = 0.0127 ± 0.0009, A2 = 1.2 ± 0.3, k2 ≤ 1 × 10⁻⁴; (B) peptide 124-129 (GSH), A1 = 0.99 ± 0.04, k1 = 0.023 ± 0.002 min-1; peptide 124-129 (GSO3−), A1 = 3.8 ± 0.1, k1 = 0.022 ± 0.003 min-1; (C) peptide 133-140 (GSH), A1 = 1.12 ± 0.03, k1 = 0.0045 ± 0.0006 min-1; peptide 133-140 (GSO3−), Afast = 0.9, A1 = 5.09 ± 0.09, k1 = 0.013 ± 0.001 min-1; (D) peptide 108-123 (GSH), A1 = 1.07 ± 0.07, k1 = 0.26 ± 0.03 min-1; 108-123 (GSO3−), A1 = 1.04 ± 0.03, k1 = 0.17 ± 0.02 min-1.
