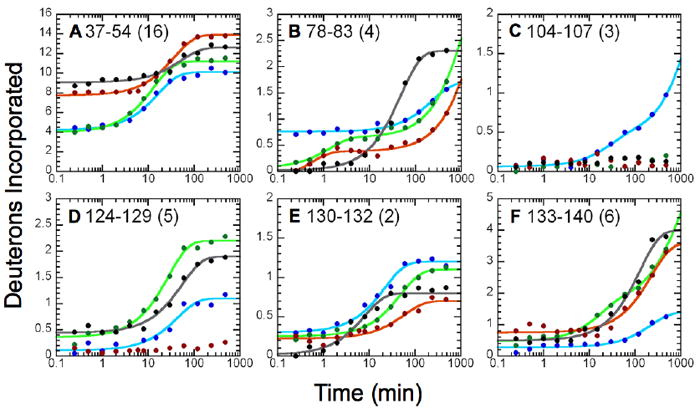
Figure 5.

Effects of inhibitor binding on the H/D exchange kinetic profiles of six peptides; (A) peptide 37-54; (B) peptide 78-83; (C) peptide 104-107, (D) peptide 124-129, (E) peptide 130-132 and (F) peptide 133-140. The kinetic profiles for the MPGES1•GSH complex are illustrated in blue, MPGES1•GSH•2 (black) MPGES1•GSH•3 (red) and MPGES1•GSH•4 (green). The rate constants and amplitudes derived from kinetic analysis are given in Table 1.
