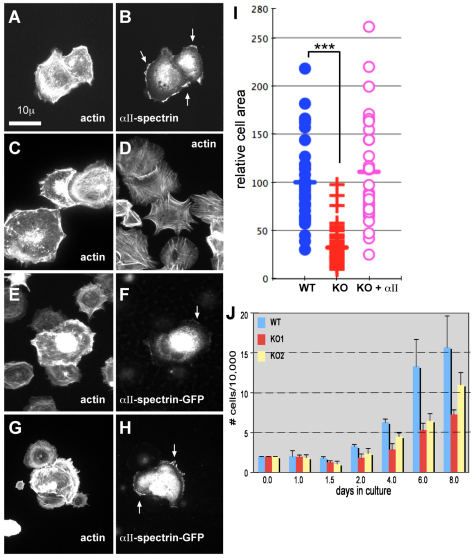
Fig. 6.
MEFs lacking intact αII-spectrin display impaired growth and spreading, and altered morphology. (A,B) MEFs from E14.5 embryos were plated onto fibronectin, grown for up to 3 hours, and stained as indicated. The images shown here were from cells examined at 30 minutes after replating. (A) MEF from wild-type cells, stained for F-actin with rhodamine phalloidin. Note the peripheral cortical and perinuclear actin, cell spreading, and abundant ruffling edges and lamellipodia. (B) Same wild-type cells as in A, stained for αII-spectrin. Note the coincidence of spectrin with the ruffling edge (arrows). (C,D) MEFs from Spna2+/+ (C) or Spna2−/− (D) embryos under same conditions as in A, stained for actin. Note the lack of spreading and lamellipodia, and abundant filopodial projections and stress filaments in the spectrin-deficient cells. (E–H) MEFs from Spna2−/− embryos under same conditions as A, but transfected with wild-type GFP-labeled αII-spectrin. Double immunofluorescent images are shown, stained for actin or GFP. Arrows mark the accumulation of GFP–spectrin at the ruffling edge and lamellipodia. Note the recovery of cortical and perinuclear actin, ruffling, and spreading in the transfected cells expressing GFP–αII-spectrin. (I) Scatter diagram of individual cell areas of MEFs from Spna2+/+ (WT) or Spna2−/− (KO) embryos, or from Spna2−/− cells transfected with GFP–αII-spectrin (KO+αII). The KO cells are significantly less spread, with an average area just 32% of wild-type cells (***P≤1.6×10⁻¹⁶); there is no difference in area between the wild-type cells and the Spna2−/− cells transfected with GFP–αII-spectrin. (J) Comparison of cell growth in culture, as measured by cell count, of wild-type and two MEF lines (KO1, KO2) independently derived from separate Spna2−/− embryos.

