Fig. 1.
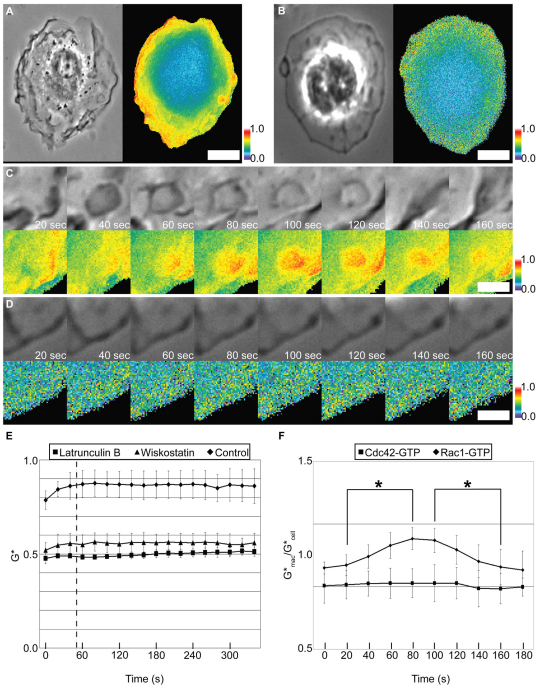
Focal activation of Rac1 during macropinocytosis. (A–D) FRET interactions of Cerulean-PBD and Citrine–Rac1 in control (A,C) and latrunculin B-treated BMM (B,D) in response to M-CSF. (A,B) Left: Phase contrast; right: G*. Scale bars: 4 μm. (C,D) Time series for subregions of the cells shown in A and B, highlighting a forming macropinosome (C), and a comparable region of a latrunculin B-treated cell (D). Top row: Phase contrast; bottom row: G*. Scale bars: 1 μm. All color bars indicate G* values. (E) Quantification of total Citrine-Rac1 activity in control and latrunculin B- or wiskostatin-treated BMM (n=5 for all conditions). Dotted line indicates when M-CSF was added. (F) To quantify GTPase activation, the average G* in a forming macropinosome was divided by the average G* in the entire cell at each time point (n=10 for each). The resulting ratio indicates the relative change in GTPase activity in the forming macropinosomes, with numbers greater than 1.0 indicating localized increases in activity. Sequences were aligned by the timing of ruffle closure (t=60 seconds). Ratios for Rac1 were significantly higher than cytoplasm values (*P<0.001) from 80 to 100 seconds following the beginning of macropinosome formation. Ratios for Cdc42 did not significantly change during macropinosome formation. Error bars indicate s.d.

