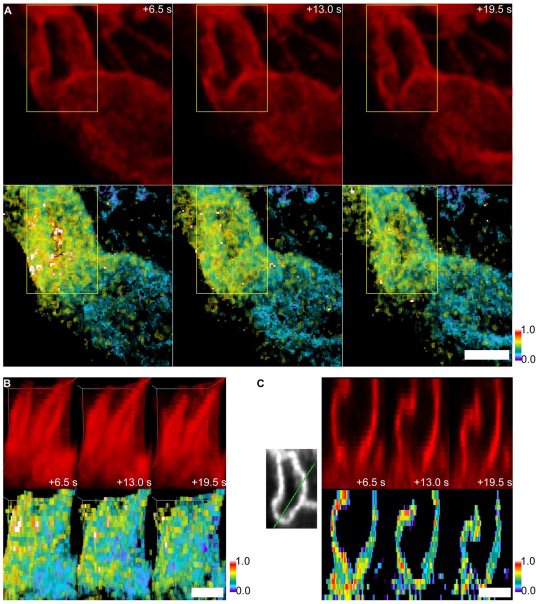
Fig. 3.
4D reconstruction of activated PAGFP-MEM in an open macropinocytic cup. Through-focus z-stacks were collected of PAGFP-MEM and mCherry at regular intervals after photoactivation of PAGFP-MEM in a cup. (A,B) Projections of a macropinocytic cup. Top row: mCherry–MEM; bottom row: PAGFP:mCherry ratio. From left to right: 6.5, 13.0 and 19.5 seconds after activation of PAGFP-MEM. (A) XY projection of a macropinocytic cup and surrounding cellular region. Yellow boxes delineate the macropinocytic cup. (B) XZ projections of the macropinocytic cup (side view). Fields correspond to the regions marked by the yellow boxes in A. (C) Cross-sections of macropinocytic cups showing distribution of mCherry–MEM (red) and PAGFP:mCherry ratio (pseudocolor) at 13 seconds after photoactivation of PAGFP-MEM. Green line shows region of cross-section. Color bars indicate relative fluorescence intensities of ratio images. Scale bars: 1.0 μm.

