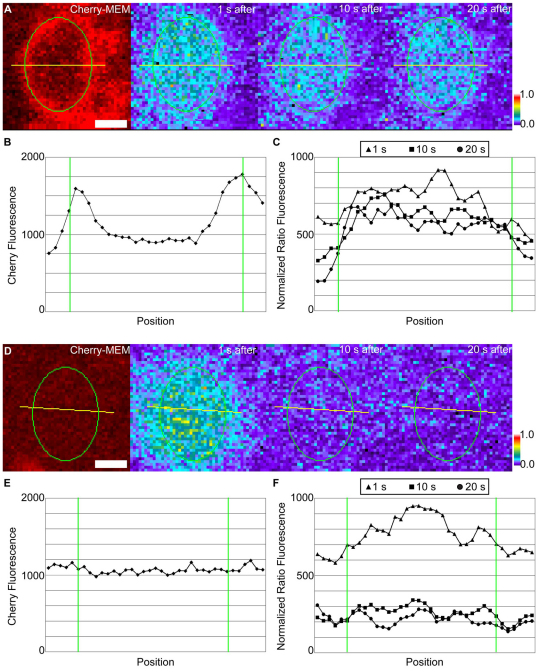
Fig. 4.
Fluorescence intensity linescans of cupped and flat membrane. (A,D) Representative linescans (yellow lines) in cupped and flat membrane, respectively. From left to right: mCherry–MEM image 1 second prior to activation, PAGFP:mCherry ratio image 1 second after activation, ratio image 10 seconds after activation, ratio image 20 seconds after activation. Scale bars: 1.0 μm. Color bars indicate relative fluorescence intensities of ratio images. (B,E) Linescans of mCherry–MEM fluorescence intensities in cupped and flat membrane, respectively. (C,F) Linescans of PAGFP/mCherry fluorescence ratios in cupped and flat membrane, respectively, at 1, 10 and 20 seconds after photoactivation. Green lines indicate the perimeter of the activation region. Similar fluorescence patterns were seen for seven macropinocytic cups and for ten regions of flat membrane.

