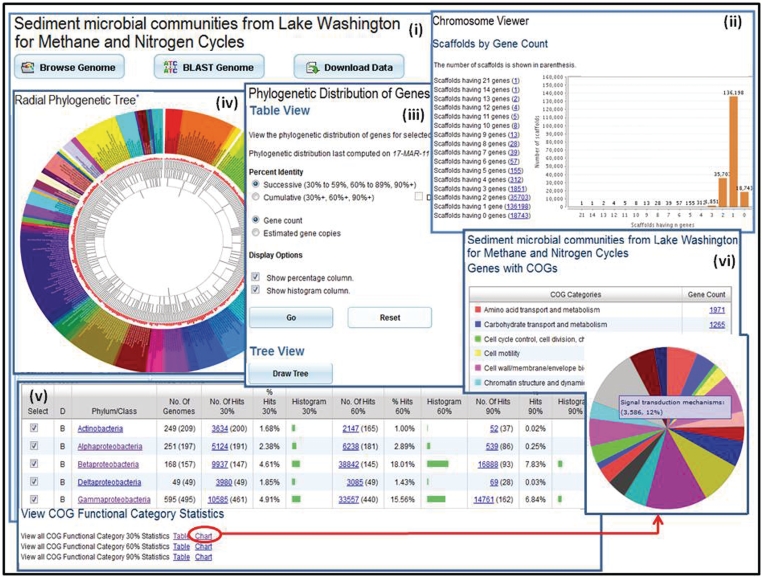
Figure 2.
Metagenome data exploration. (i) Microbiome samples, such as the Sediment microbial communities from Lake Washington for Methane and Nitrogen Cycle sample, can be examined using the ‘Microbiome Details’ page, which provide tools for browsing, searching or downloading the metagenome data. (ii) ‘Scaffold Cart’ allows selecting individual scaffolds or groups of scaffolds based on properties such as gene content. (iii) The ‘Phylogenetic Distribution of Genes’ provides an estimate of the phylogenetic composition of a metagenome sample based on the distribution of the best BLAST hits of the protein-coding genes in the sample. The result of ‘Phylogenetic Distribution of Genes’ can be displayed using (iv) the ‘Radial Phylogenetic Tree’ viewer or (v) in a tabular format consisting of a histogram with counts protein-coding genes in the sample, which have best BLASTp hits to proteins of isolate genomes in each phylum or class with >90% identity (right column), 60–90% identity (middle column) and 30–60% identity (left column). (vi) The organization of genes by their assignment to COGs is displayed in a pie chart format.

