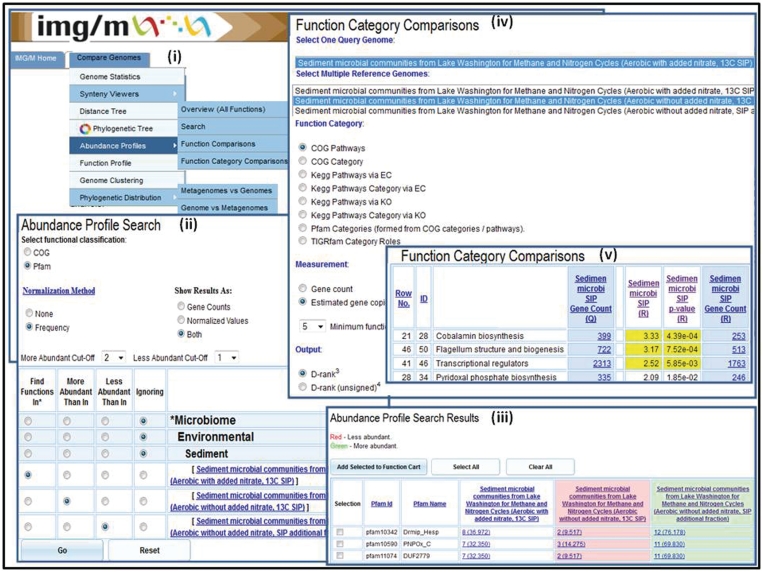
Figure 3.
Abundance profile and function comparison tools. The ‘Abundance Profile Search’ allows finding protein families (COGs and Pfams) in metagenomes and isolate genomes based on their relative abundance, such as (ii) finding all Pfams in the Sediment microbial communities from Lake Washington (Aerobic with added nitrate, 13C SIP) sample, which are at least twice as abundant as in the Sediment microbial communities from Lake Washington (Aerobic without added nitrate, 13C SIP) sample and are at least twice less abundant than in Sediment microbial communities from Lake Washington (Aerobic without added nitrate, SIP additional fraction). (iii) The ‘Abundance Profile Search Results’ consists of a list of protein families that satisfy the search criteria together with the metagenomes or genomes involved in the comparison and their associated raw or normalized gene counts. (iv) The ‘Function Category Comparison’ tool allows comparing a metagenome data set with other metagenome data sets or reference genome data sets in terms of the relative abundance of functional categories (COG Pathway, KEGG Pathway, KEGG Pathway Category, Pfam Category and TIGRfam Role Categories). (v) The result of ‘Function Category Comparison’ lists for each function category, F, the number of genes and estimated gene copies in the target (query) metagenome associated with F and for each reference genome/metagenome the number of genes or estimated gene copies associated with F, as well as an assessment of statistical significance in terms of associated P-value and d-rank.

