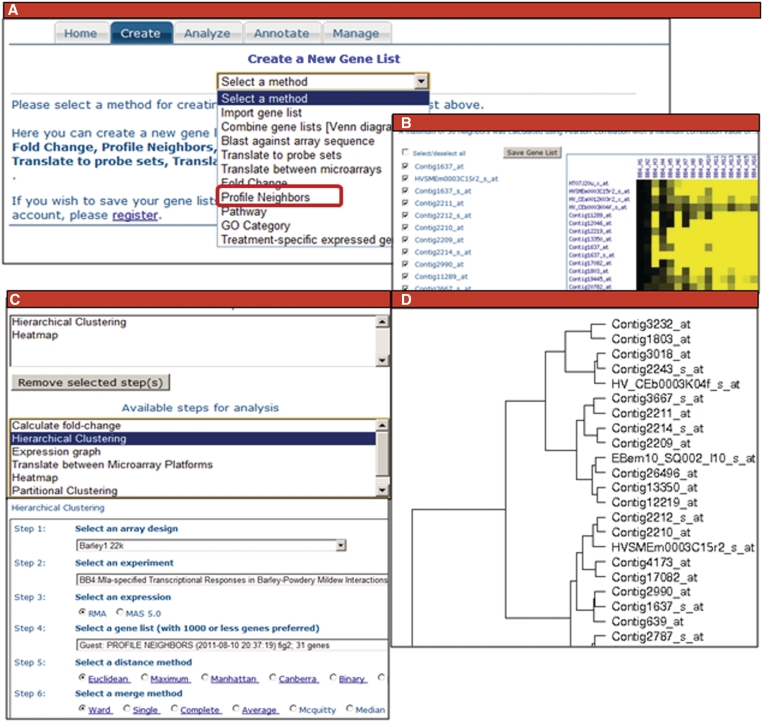
Figure 3.
Collage of web interface panels from the PLEXdb Gene List Suite. On the input page (A), users select what they would like to do. (B)shows the inputs and outputs for creating a gene list by selecting profile neighbors. Users may further evaluate the gene list using the Analysis page (C), where they may select multiple analysis steps to be used for the gene list. (D) shows the results of hierarchically clustering the gene list of profile neighbors using BB4 data sets.

