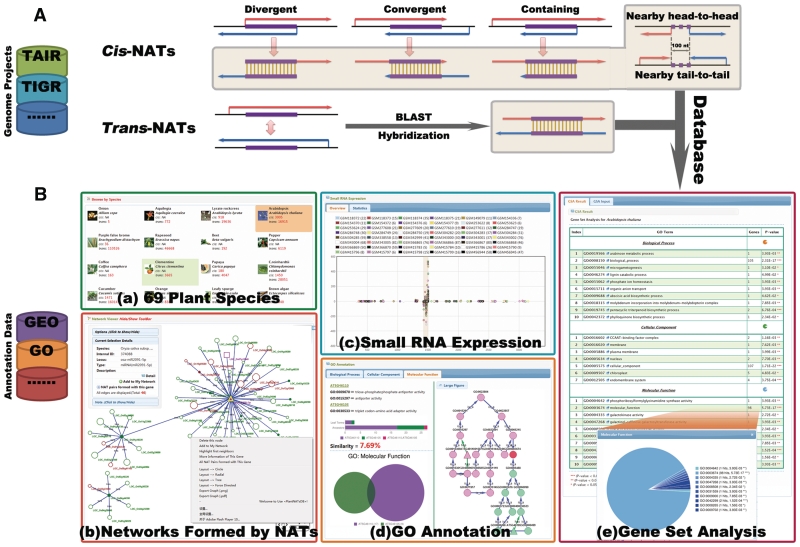
Figure 1.
System overview of PlantNATsDB core framework. (A) Schematic presentation of the five different types of cis-NATs (natural antisense transcripts) (i.e. Divergent, Convergent, Containing, Nearby head-to-head and Nearby tail-to-tail) and the trans-NATs predicted by PlantNATsDB. The complementary regions are highlighted and linked with vertical lines. Sequences used for NAT prediction were retrieved from variously public databases, as detailed in the website page. All NATs predicted by PlantNATsDB were deposited in MySQL relational databases. (B) Highlighted features of PlantNATsDB, which integrates various data to evaluate the function of NATs. [B(a)] The 69 plant species currently available in PlantNATsDB. [B(b)] Network formed by different NATs displayed in the integrated network browser, which is based on Cytoscape Web program (31). Note that this network can be edited and used for further analysis, such as ‘Gene Set Analysis’. An example of the output for ‘Small RNA Expression’ of a NAT pair is shown in [B(c)] and ‘GO Annotation’ in [B(d)]. Please note that small RNAs are enriched in the overlapped region and the two genes of the NAT pair share very similar GO annotation. [B(e)] An example of the output for ‘Gene Set Analysis’ based on GO annotation. The enriched GO categories are listed in the table and the P-value indicating the significance of enrichment. The number of genes in each GO category is indicated and shown in the pie chart. Additional functional modules, such as ‘Browser’, ‘Searcher’ and ‘Viewer’ as detailed in the PlantNATsDB website.

