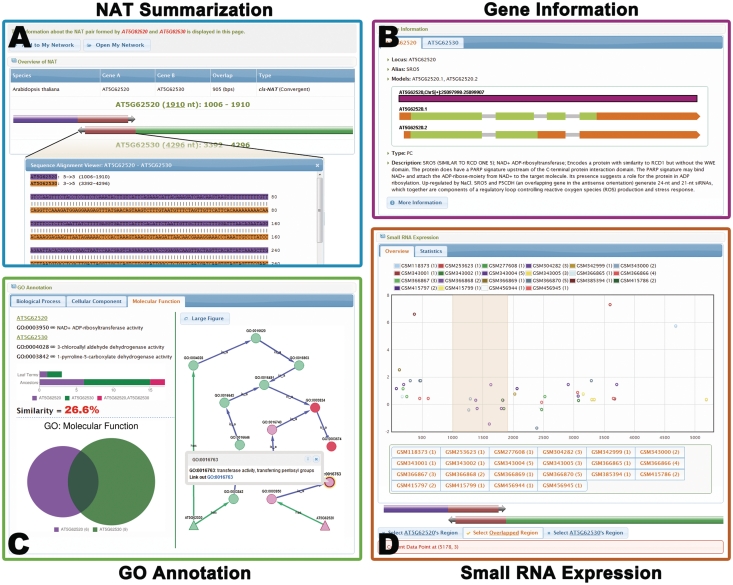
Figure 2.
The information page of the NAT pair formed by SRO5 (AT5G62520) and P5CDH (AT5G62530) (9). (A) Summary of the NAT information, including the type, sequences and length of overlapped region. The sequence of the overlapped region is highlighted below. (B) Detailed annotation of the two genes of this cis-NAT pair. (C) GO functional annotation of the two genes. The annotated GO terms are displayed in Venn chart and GO network graph. The GO network graph contains two types of nodes: those that represent the NAT pairs (triangle nodes) and those that represent GO hierarchical terms (circle nodes). The shared GO terms (red color) and specific GO terms (purple and green colors) are shown in different colors. Functional similarity of these two genes is represented by the percent of shared GO terms. (D) The expression of the small RNAs derived from the NAT pair. Small RNAs from different data sets are indicated by dots in different colors. The overlapped region is highlighted in the chart. Small RNA data sets can be added or removed for demonstration in the chart by clicking the buttons below. The enrichment score for small RNA generated from the overlapped region is calculated based on the specific data sets. Please note that there is no observation of enriched small RNA derived from the overlapped region because this NAT pair is specially formed in the salt stress condition and PlantNATsDB lacks such data sets.

