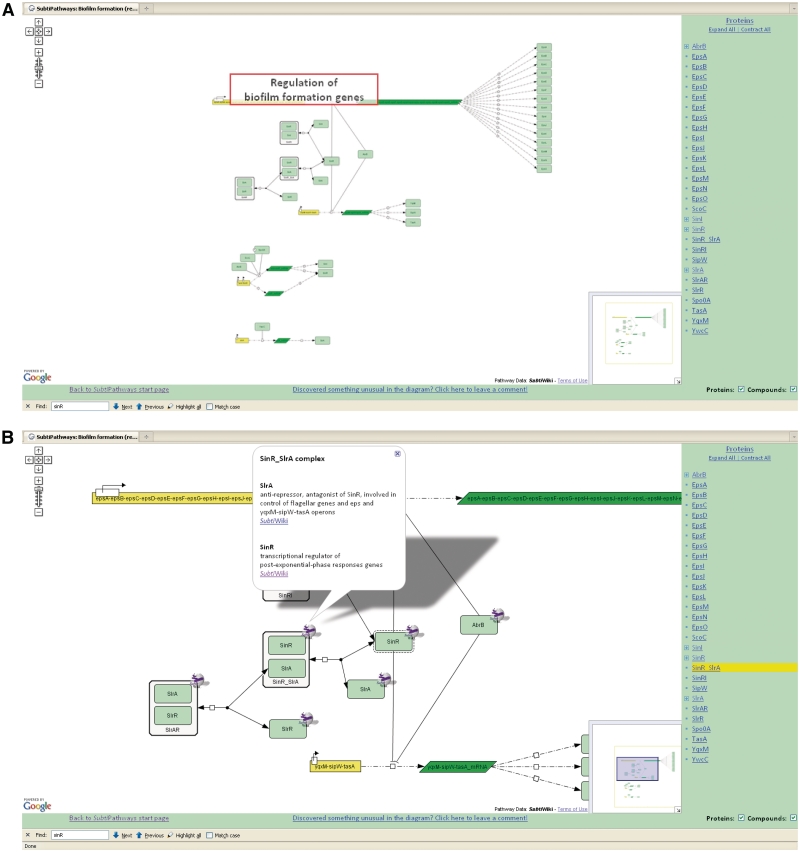
Figure 4.
Representation of Biofilm formation in SubtiPathways. Diagrams are available for a broad range of metabolic pathways and cellular processes (A). A list of all involved genes is shown on the right side and the diagram itself shows gene expression and regulation. At the highest magnification, a zoom function reveals clickable elements (B) that provide information on the protein (e.g. 3D structure, links to other pathways and SubtiWiki).

