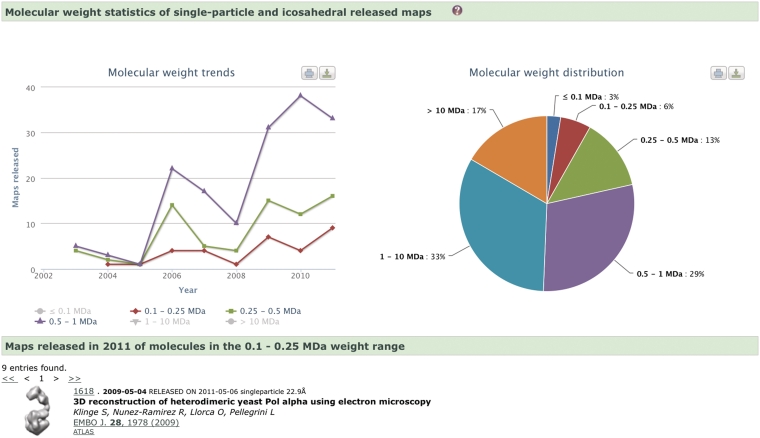
Figure 4.
Molecular weight (MW) distribution and MW trends of the assemblies (single-particle and icosahedral) whose EM maps have been deposited in the EMDB archive, as generated with EMstats (pdbe.org/emstats). The distribution chart shows that only 22% of the studies are of assemblies with MW < 0.5 MDa. This is a consequence of the technical difficulties encountered when using the single-particle technique to study low-molecular-weight molecules or complexes. However, the trend charts show that the number of such studies is gradually increasing, which suggests that the field is learning how to overcome the experimental difficulties.

