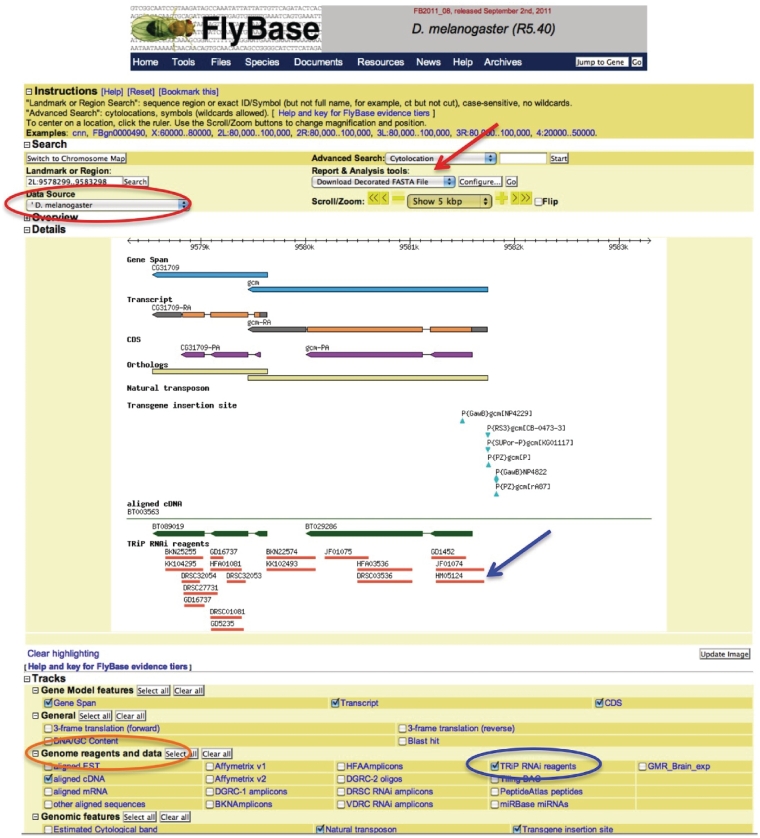
Figure 3.
GBrowse. The Data Source menu (red circle, top left), the Track Groupings (orange circle, bottom left) and the Feature Tracks (blue circle, bottom right) are shown. The features (members of the feature track) are indicated with a blue arrow. The location of the ‘table view’ option is indicated with a red arrow.

