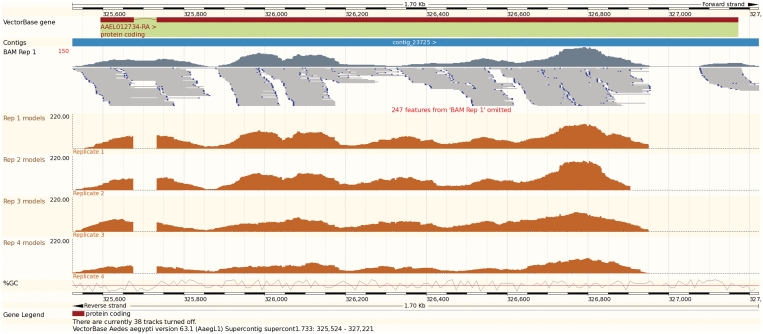
Figure 1.
Visualization of user data in the genome browser (image exported directly from the browser). The dark red boxes at the top represent the exons on transcript AAEL012734-RA, and the blue bar represents the contig sequence. The top track in dark grey represents the coverage plot of short-read alignments of an RNA-Seq experiment on the Aedes aegypti transcriptome. Individual read alignments extracted from a BAM-formatted file (4) are displayed underneath in light grey. The four orange tracks represent reconstructed transcript models in four replicates of the same experiment, using a custom RNA-Seq analysis procedure. The BedGraph format was used to generate the data to keep the coverage information base by base.

