Figure 2.
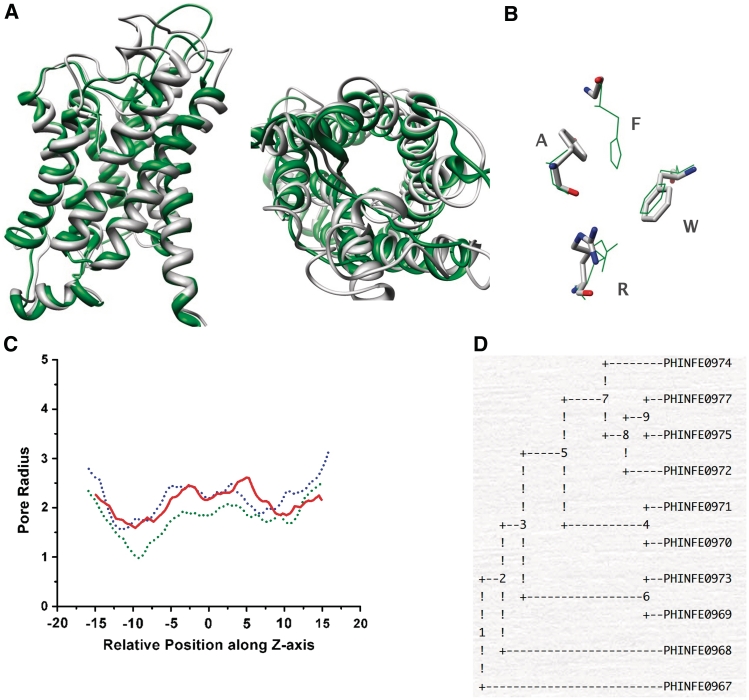
(A) Superposition of the modeled MIP structure with 1J4N, the structure of bovine aquporin shown in two different orientations, namely, parallel (left) and perpendicular (right) to the channel axis. (B) The four residues of the ar/R selectivity filter superposed on that of 1J4N structure. (C) Comparison of HOLE radius profiles plotted for the water channel (green), glycerol facilitator (blue) and the modeled MIP structure (red). The ar/R selectivity filter is approximately located at −10 Å. (D) Phylogenetic tree calculated for all MIPs of a representative organism Phytophthora infestans using parsimony method.

