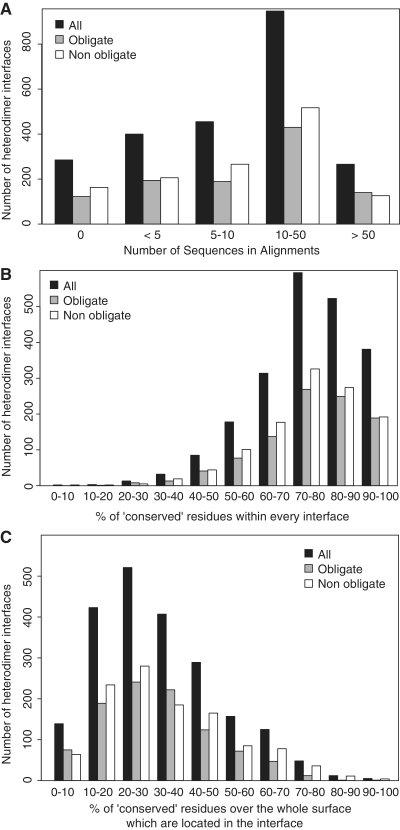
Figure 3.
(A) Histogram reporting the number of sequences retrieved in the interologs multiple sequences alignments which were pre-calculated in the InterEvol database for every heteromeric binary interaction. (B) Evolutionary rates for every position of a chain were computed with the Rate4Site algorithm (49) for the heterodimer interologs alignments containing at least 10 sequences. These evolutionary rates were binned into nine classes of conservation and positions were considered ‘conserved’ when they belong to the three most conserved classes. The histogram reports the number of heterodimer interfaces containing a given percentage of ‘conserved’ positions. (C) The ‘conserved’ positions were identified as in (B). For every binary heterodimer, the ratio between the number of conserved positions at the interface and the total number of conserved positions exposed at the surface of the chain was calculated. For every range of ratio, the histogram represents the number of binary heteromers obtained.

