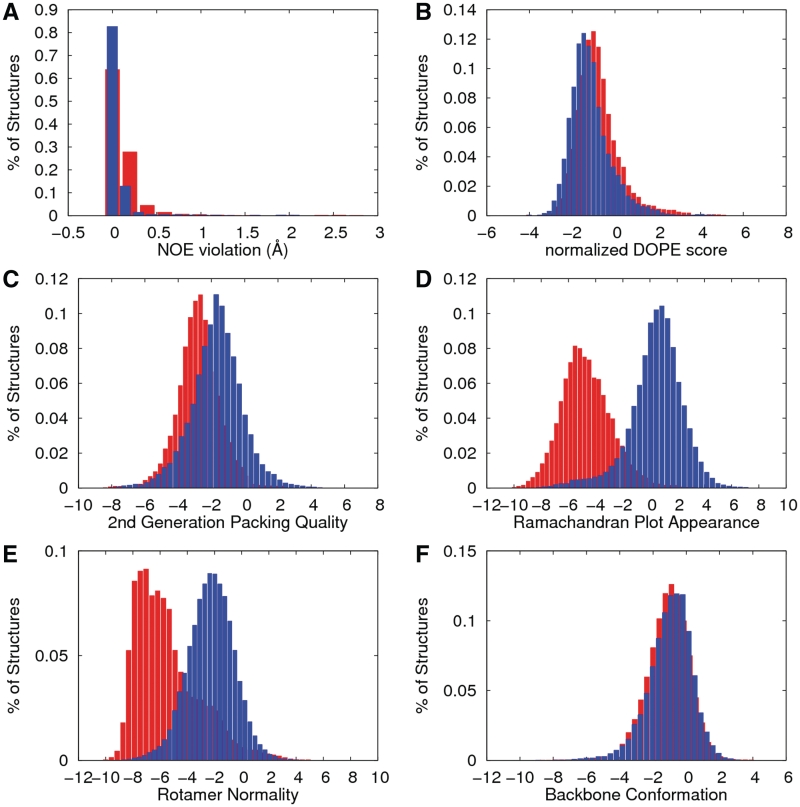
Figure 1.
Distribution of the protein quality assessment of the original (red) and refined structures (blue bars). The figures present the distributions of the 2405 selected NMR structures as follows: (A) the RMS value of the NOE violations, (B) the normalized DOPE score, (C) the 2nd-generation packing quality (all backbone and side chain contacts), (D) the Ramachandran plot appearances, (E) the χ1–χ2 rotamer normality and (F) the backbone conformation. The values were measured by dDFIRE, AQUA and WHAT_CHECK.

