Figure 2.
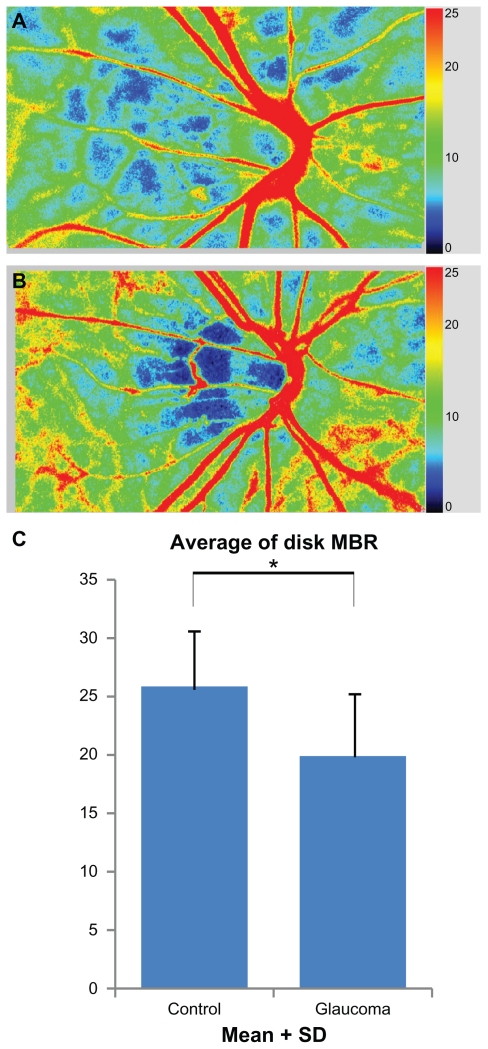
Comparisons of MBR of the entire optic disk area between control and glaucoma group. The color scale bars in Figure 2A and B show the degree of MBR. The proportions of cool colors in the optic disk, which represent low MBR, are increased in the map of the glaucomatous eye rather than those of the control. (A) A color-coded map of ocular fundus of a control eye. The eyes in control group have myopic disk without glaucomatous visual field loss. (B) A color-coded map of ocular fundus in a glaucomatous eye. (C) Comparisons of MBRD between two groups. There are significant differences in these parameters between control and glaucoma groups.
Notes: *Glaucoma group significantly different from control group (Mann–Whitney U test; P < 0.05)
Abbreviations: MBR, mean blur rate; MBRD, average MBR over the entire optic disk.

