
Fig. 1.
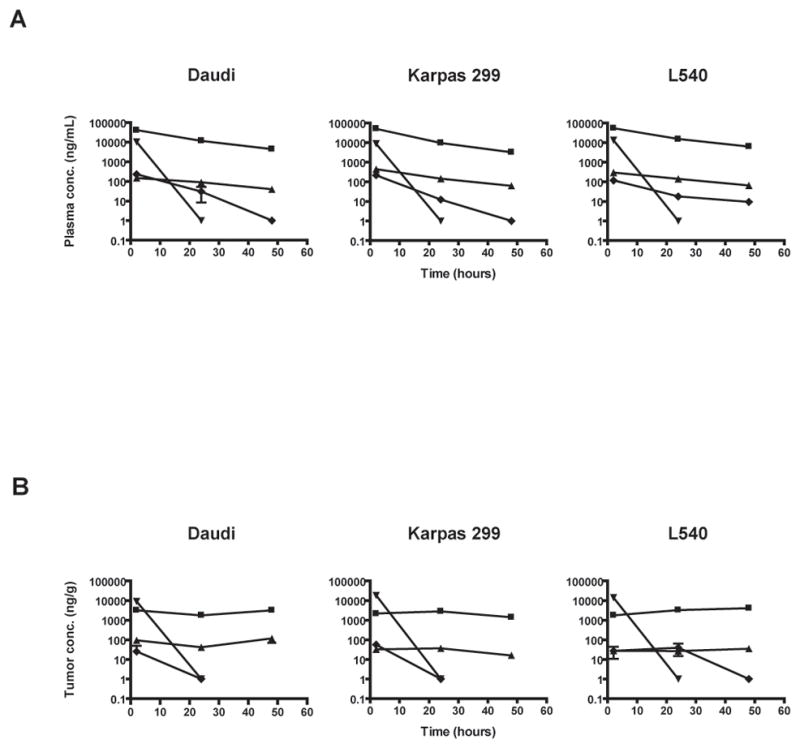
(A) Plasma concentration of polymer-bound (■), free CPT (▲), CPT-11 (▼), and SN-38 (◆) as a function of time after a single bolus i.v. injection of IT-101 (10 mg/kg) and a single i.p. injection of CP-11 (100 mg/kg). (B) Tumor concentration of polymer-bound (■), free CPT (▲), CPT-11 (▼), and SN-38 (◆) as a function of time after a single bolus i.v. injection of IT-101 (10 mg/kg) and a single i.p. injection of CPT-11 (100 mg/kg). Points and error bars indicate mean and standard error of mean, respectively.