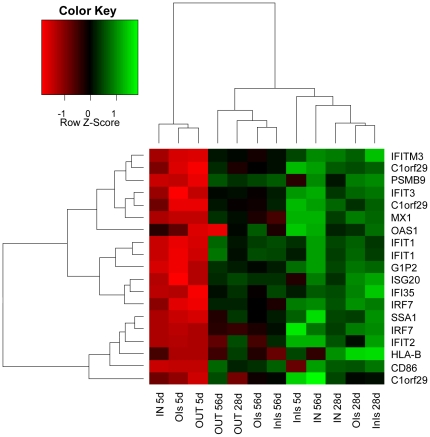
Figure 6. Heatmap of IFN-induced gene subset.
A heatmap of IFN-related genes was generated from a subset extracted from the list of significantly expressed genes. Columns represent individual arrays, while rows represent specific genes of interest. The Z-score depicts a measure of distance, in standard deviations, away from the mean. The relative value for each gene is depicted by color intensity, with green indicating upregulated and red indicating downregulated genes.

