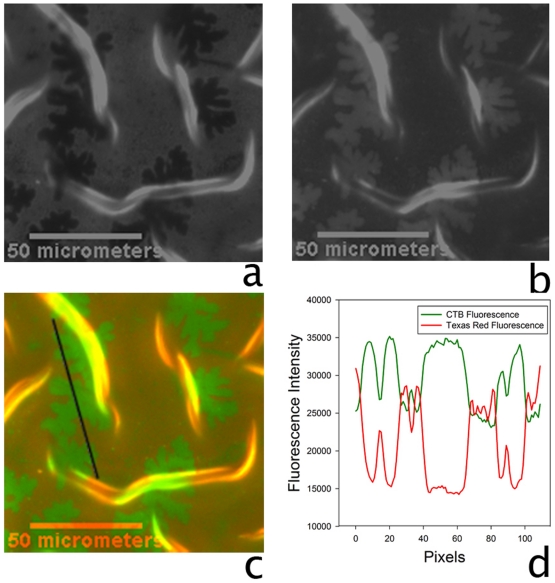
Figure 5. Epiflourescence images showing fluorescent cholera toxin bound to the bilayer.
Constrained re-equilibration of a bilayer consisting of TR-DHPE/GM /CH/DOPC/Egg-SM (1/0.5/5/74/19.5) on a dynamically buckled PDMS substrate. Fluorescence images taken after FITC-tagged cholera toxin subunit B was applied to a bilayer on PDMS. a, the Texas Red channel; b, the FITC channel; c, the combined fluorescence channel. Scale bar
  m. Panel d compares the linescan of the fluorescence intensities shown in panel c.

