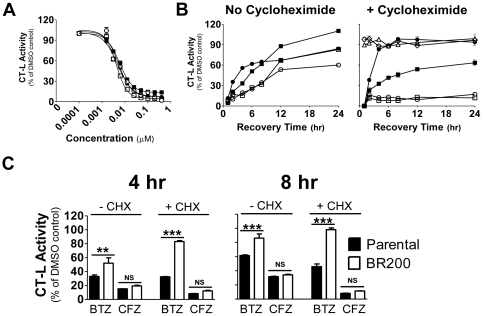
Figure 2. Increased proteasome turnover in bortezomib-resistant cells.
(A) Parental (▪,□) and BR200 cells (•,○) were cultured for 3 days in the absence of drug prior to exposure to varying concentrations (1 nM–1 µM) of bortezomib (closed symbols) or carfilzomib (open symbols) for 1 hr. Proteasome chymotrypsin-like activity was measured using LLVY-AMC as substrate and specific activity values were normalized to DMSO controls. Data are presented as the mean relative activity (± S.E.M.) and is representative of 2 replicate experiments. (B) Parental (▪,□) and BR200 cells (•,○) were exposed to 100 nM bortezomib (closed symbols) or carfilzomib (open symbols) for 1 hr, washed and cultured in drug free media with or without cycloheximide for 1, 2, 4, 6, 8, 12 , and 24 hr prior to measurement of chymotrypsin-like activity. Parental cells (Δ) and BR200 (◊) cells treated with CHX alone in the absence of drug are included as additional controls. Data are presented as the mean relative activity (± S.E.M.) and is representative of 2 replicate experiments. (C) Relative chymotrypsin-like activity in parental and BR200 cells at 4 or 8 hr after a 1 hr pulse exposure to 100 nM bortezomib or carfilzomib in the presence or absence of cycloheximide. ** = P<0.01; *** = P<0.001 by one-way ANOVA followed by Newman-Keuls post-hoc comparisons.

