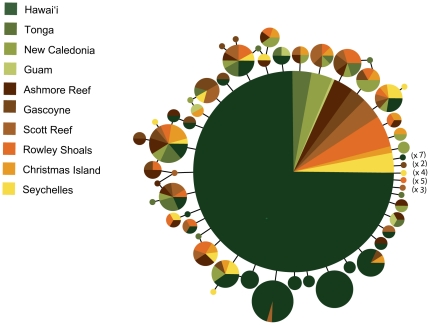
Figure 2. Median-joining network for Pristipomoides filamentosus.
Network was constructed using the program network 4.6 [40] using 503 bp of cytochrome b from 1,202 individuals. Each circle represents one haplotype and the area of the circle is proportional to the number of individuals with that particular haplotype and colors represent collection location (see key). The multipliers in parentheses indicate additional singleton haplotypes observed only at the color coded locations.

