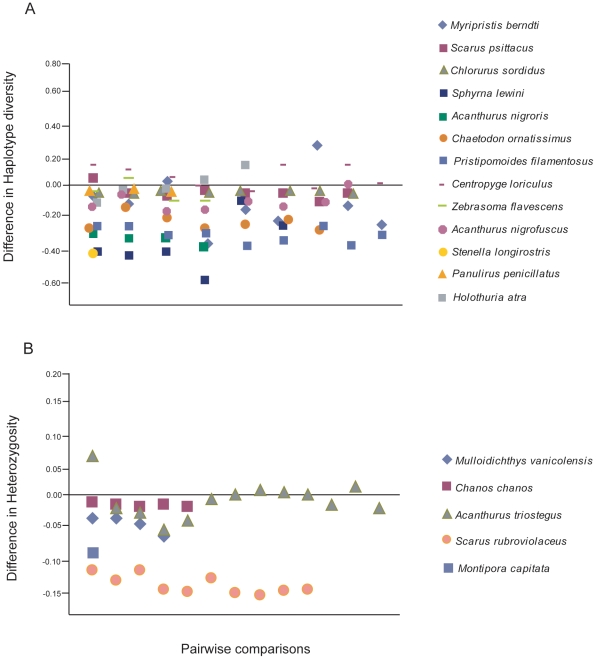
Figure 5. Plots of diversity indices for eighteen widely distributed species of marine organisms.
Numbers were calculated by subtracting the A) haplotype diversity (mitochondrial data) or B) expected heterzygosity (microsatellite or allozyme data) of the Hawaiian population from each of up to thirteen populations (X-axis) across the Indo-Pacific. For Chanos chanos and Acanthurus triostegus indices for multiple Hawaiian populations are reported in the reference and a single index could not be obtained from the authors, therefore, the island of O'ahu was chosen to represent Hawai'i. In the case of Acanthurus triostegus the indices reported are observed heterozygosities. Points below the zero line indicate that the Hawaiian population demonstrated lower genetic diversity (96 of 114 comparisons demonstrated lower diversity in Hawai'i; Chi-square = 43.0, df = 1, P<0.0001). Only Hawaiian populations of C. loriculus and H. atra consistently (≥50%) demonstrated higher genetic diversity when compared to populations in the Indo-Pacific. See Table 5 for references.

