
Figure 6.
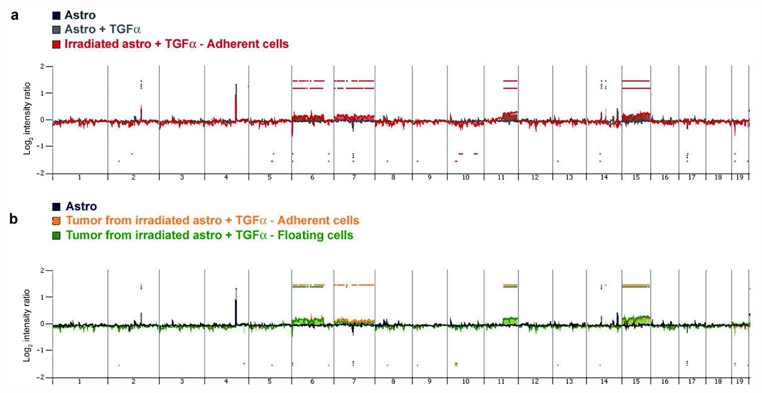
a. Profile of gains and losses of irradiated TGFα-treated astrocytes growing in the form of adherent cells (red), compared with their non-irradiated sister cells (grey), and non-irradiated astrocytes maintained in serum-free medium (black). Shown are log 2 ratios for each chromosome. Non-irradiated astrocytes exhibited the same profile irrespective of exposure to TGFα. Irradiated TGFα-treated astrocytes exhibited gains in chromosomes 6, 7, 11 and 15. b. Profile of gains and losses of subcutaneous tumors derived from irradiated TGFα-treated astrocytes growing in the form of adherent cells (yellow) or floating cells (green).