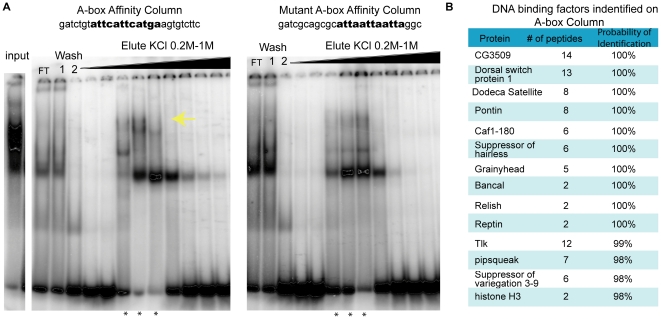
Figure 4. Affinity chromatography and mass spectrometry was used to identify factors that bind the A-box element.
(A) shows the EMSAs preformed using γ32P-labeled A-box oligonucleotides on nuclear extract fractions after they were affinity purified with the A-box column and the mutant A-box column. FT denotes the flow through which did not bind to the column. The black arrow marks the area where the A-box specific binding was found. The stars mark the samples used for mass spectrometry identification. (B) The table lists the DNA binding factors that bound to the A-box element column but not the mutant A-box column. The “# of peptides” corresponds to the number of unique peptides that contributed to the protein identification. The probability of identification was calculated by the program Scaffold used to identify the proteins by mass spectrometry analysis and corresponded to the likelihood a correct match was made.

