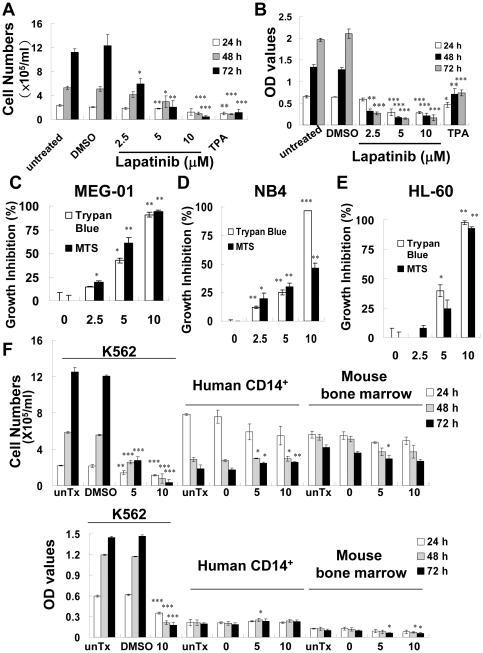
Figure 1. Inhibition of leukemia cell proliferation by lapatinib.
K562 CML cells were left untreated or were treated with 0.1% dimethyl sulfoxide (DMSO, vehicle), DMSO with different doses of lapatinib (2.5, 5, or 10 µM), or 12-O-Tetradecanoylphorbol 13-acetate (TPA) 10 µM for 1 to 3 days as indicated. (A) Cell numbers for each treatment were counted using trypan-blue dye exclusion assay. (B) Relative numbers of viable cells were detected using MTT assay. (C–F) Inhibition of cell proliferation by lapatinib in leukemia cell lines, but not in primary CD14+ mononuclear or bone marrow cells. 1×10⁵/ml CML MEG-01 (C), AML NB4 (D), HL-60 cells (E), K562, or 5×10⁵/ml human CD14+ mononuclear and mouse bone marrow cells (F) were untreated (unTx), treated with DMSO vehicle (0), or DMSO with different doses of lapatinib (µM) for 2 (C), 3 (D–E), or 1–3 days (F). The raw data (B and F) or relative percentage of growth inhibition (C–E) were assessed and calculated using both trypan-blue dye exclusion and MTS assays (C–E) or MTT assays (F) as indicated in each figure as described in (A–B). Optical density (OD) values from DMSO-treated control cells were used as a standard (0% cell death), and the relative percentage of growth inhibition was calculated using the following method: [(mean OD values from DMSO-treated cells – mean OD values from drug-treated cells)/mean OD values from DMSO-treated cells]×100. The data are expressed as the mean ± SEM. *P<0.05, **P<0.01, ***P<0.001 (t-test) between lapatinib-treated and DMSO control cells.

