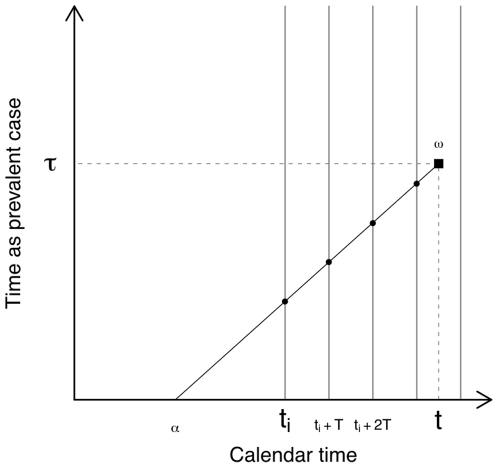
Figure 1. Modelling prevalence given incidence.
An active TB case develops at  , and remains active until
  . The probability that this case avoids death, self-cure or detection by routine services to remain active at
  is
is  . In the presence of
  -periodic active case-finding (vertical lines) beginning at time
  , the case must also avoid detection by intersection with
  case-finding rounds (marked as filled circles), which occurs with probability
  .
.

