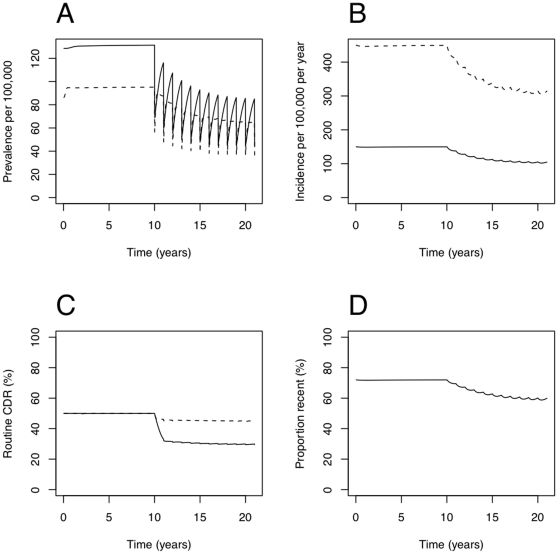
Figure 2. Example dynamics with yearly rounds from year 10.
Panel A: prevalence of active undetected TB (dashed line for HIV-infected TB, solid line for HIV-uninfected TB; total population as denominator). Panel B: incidence of active TB (dashed line for HIV-infected TB, solid line for HIV-uninfected TB; total population as denominator). Panel C: case detection rate by routine services. Dashed line for HIV-infected TB, solid line for HIV-uninfected TB. WHO definition, i.e. the preceding year's detections divided by the preceding year's incidence. Panel D: the proportion of incident TB due to recent infection. All panels for the default parameters in Table 1, with  , and
, and  .
.

