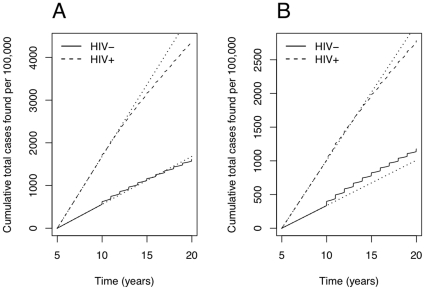
Figure 3. Cumulative cases found by both active and passive systems.
Solid lines for HIV-uninfected TB, dashed lines for HIV-infected TB, and dotted lines for cumulative cases without interventions beginning at year 10. Both panels are for the default parameters of Table 1, with  . Panel A has
  , whereas panel B has case detection rates
  . Fewer HIV-infected TB cases are found in total under the intervention in both panels. Fewer cases of HIV-uninfected TB are found in panel A, and more cases of HIV-uninfected TB in panel B.

