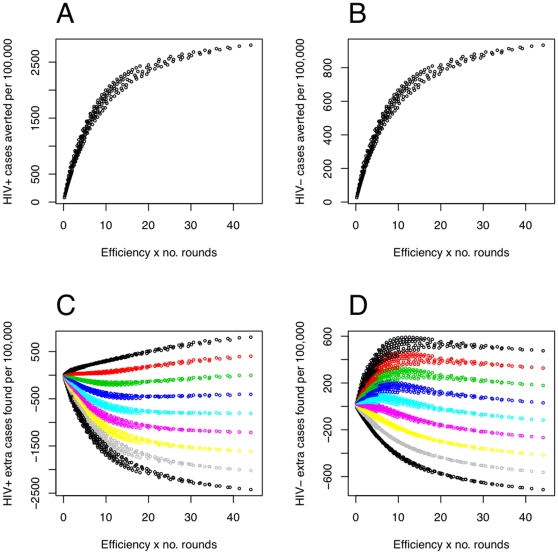
Figure 4. Cases found and averted for different round efficiencies, periods and initial case detection rates.
Results from numerical model experiments plotted against the product of round efficiency and the number of rounds during the 10 year intervention period, in a population of 100,000. Panels A and B are the total HIV-infected and HIV-uninfected TB cases averted, respectively. Panels C and D are the total HIV-infected and HIV-uninfected TB cases found by both routine and active routes, respectively. Panels C and D have points colored by initial case detection rates; initial case detection rates do not affect cases averted. Realistic levels of achievement would be below  , or a perfectly efficient round once a year. All panels have parameters other than those varied set to the default parameters of Table 1, although the overall level of incidence only affects the scales here. The round efficiencies,
  , were chosen to vary from 10% to 90% in increments of 10%; and 28 values of the period
  were investigated, chosen so that the number of rounds over the 10 years was an integer in the range 2 to 49.

