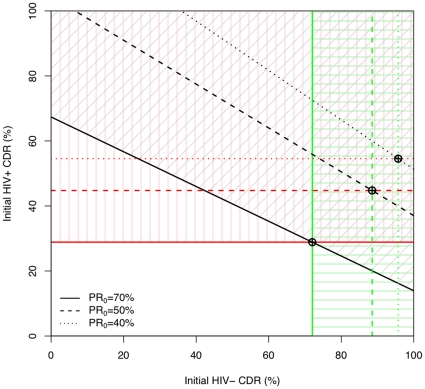
Figure 5. Approximate regions with fewer cases in total over the 10 years of the intervention.
The red, vertically hatched regions are the critical initial case detection rates for HIV-infected TB, above which fewer HIV-infected TB cases are found by the combination of routine and active routes over 10 years. The green, horizontally hatched regions are the critical initial case detection rates for HIV-uninfected TB, above which fewer HIV-uninfected TB cases are found by the combination of routine and active routes over 10 years. The grey, diagonally hatched region indicates fewer total cases regardless of HIV-status. The default parameters of Table 1 are used but with  . The HIV prevalence in incident TB affects the slope of the diagonal line, but the main factor that changes this picture is the initial proportion recent: results for
  and
and  are indicated by dashed and dotted lines, respectively.

